
Phase Portraits
Now I want to introduce you to a nice online tool which might help you plot some of these slope fields. (if you get tired of doing this by hand and your calculator can't plot these for you) It is called PPLANE (named for the term phase plane, of course). It is being developed by John C. Polking and some of his colleagues at Rice University. The software is really just a set of m-files that MatLab executes. MatLab is a Matrix Laboratory software package that is very popular with many mathematicians and engineers. Before you actually visit the site, you should remember that there are a few syntax notes that you need to understand. After all, this is a computing tool, much like a calculator, and it requires a certain syntax in order to function properly. You may want to keep this window open while you are using the tool so that you can read through the following notes as you plug along for the first time. Just minimize it and pull it up whenever you need it. The link to PPLANE is at the bottom of the page, but read (at least skim it, please) through the following before you click. As you may have guessed by now, the directions are essentially the same as those for the DFIELD tool.
- There will be several windows that pop up as you get started. As the software is cranking up, you will have to click OK on the copyright box in order to get started. Managing all of these windows will require some ingenuity on your part.
- Two Basic Windows:
- The two basic windows that you will work with are the Equation Window and the Phase Plane Window.You may have to adjust the size of the Equation Window in order to see the contents of all the boxes. The Equation Window is where you enter the differential equation. Notice that there is already an equation entered for you. There is a box which tells PPLANE which variable is the independent variable. There are also some parameters in the equation-- a and b. The values of those parameters can be adjusted in the boxes under the heading Parameter Expressions. One can also adjust the maximum and minimum values of the graph of the slope field by using The Display Window boxes.
- Plotting a phase plane:
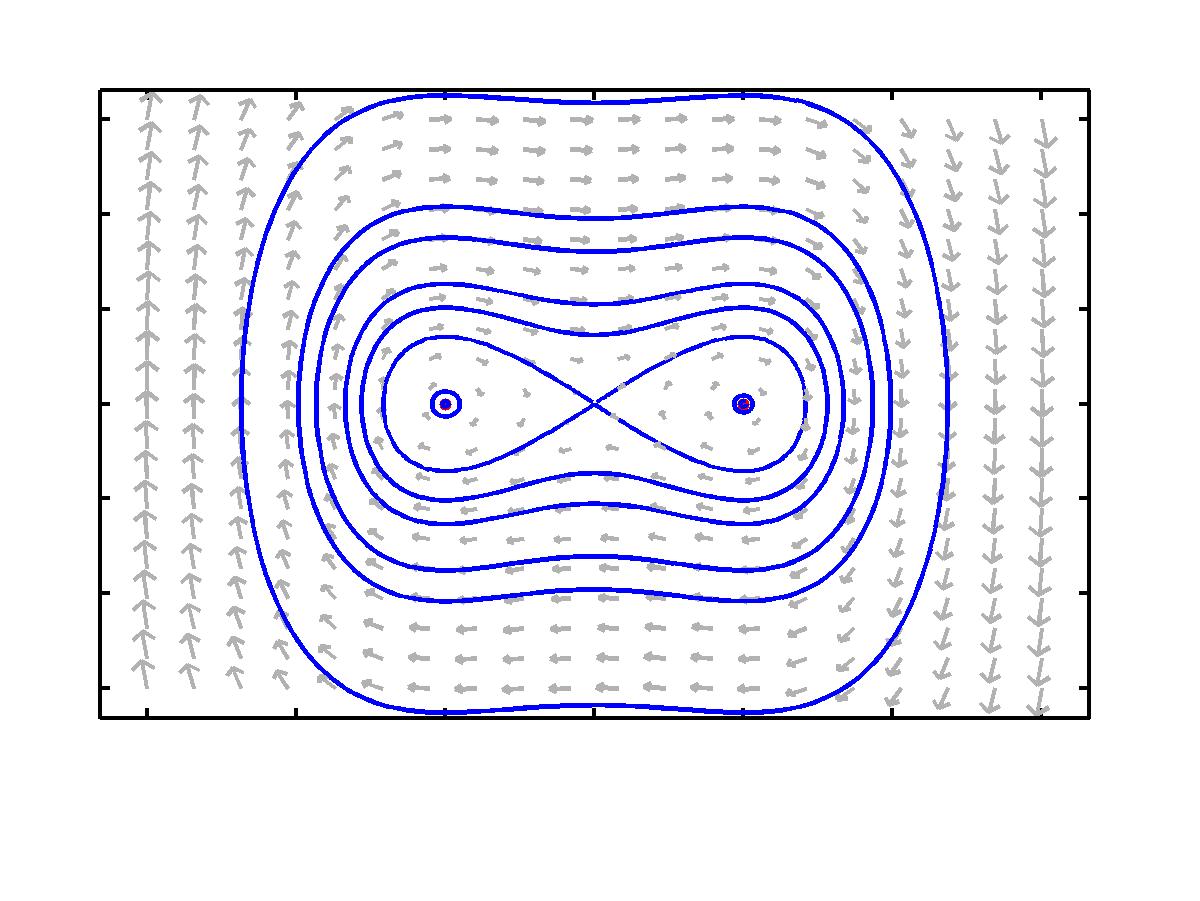
- Click on the button in the right hand corner of the Equation Window. It should say something like Graph Phase Plane. You can view the phase plane in the Phase Plane window. By using your mouse to click on a point in the direction field, you can generate a sketch of the solution to your first order system of ODEs which passes through that point.
- If you are interested in a couple of examples, try looking in the Gallery menu at the top of the Equation Window.
- Basic Syntax and Operations:
- addition, +
- subtraction, -
- multiplication, *, (don't forget this one: 3x is written as 3*x)
- powers, ^, (3^2 means three squared)
- Functions:
- trigonometric, sin(3*x), (the parentheses must be there, `sin3x' will only give you syntax errors and frustrate you) and it works the same for cosine (cos(3*x)) and tangent (tan(3*x)) functions
- the exponential function e, exp(x) or exp(t^2), (again the parenthese are the big deal)
- Quitting: You may quit the application by clicking the Quit option under the File menu in the Phase Plane Window. There may also be a ``Quit'' button at the bottom of the Equation Window.
Click Here in order to use PPLANE. Note: There is some introductory stuff at the top of the page. In order to crank
up the tool, you must click on the grey button labelled PPLANE 2005.10
If you are interested in some of the more advanced options available with PPlane,
please ask me--or just hunt around on your own and experiment with some things.
Updated on: 08/22/07.